ArtaQuest Foundation · Journal of Seasonality 1, 2 (2026) · PDF · interactive version
Google Trends' most recent observations are the least reliable - sampled from incomplete data and revised later. We quantify how much recent data a time-series model should discard using a pure in-sample fitting-power criterion: crop the most recent C months of data, refit on the remainder, and record R2, sweeping C from 0 to 6 years with no hold-out or test set. Across 309 monthly series the median R2 rises from 33% (no crop) to about 55% by a knee near 12 months, then continues to climb gently to 65% by 72 months - with no interior optimum inside the window, so cropping recent data only ever helps within the range tested. The recent year-and-a-half carries the most unfittable noise; the model conservatively drops one year. We give the open data and a one-click reproduction.
Practitioners routinely drop the latest Trends points, but by how much is usually ad hoc. We propose a simple, assumption-light criterion based on fitting power alone.
For a grid of crops from 0 to 72 months we remove the most recent C months and refit the Topics Seasonality Model on the remainder, recording the best-angle in-sample R2 per field and the median across fields. We deliberately avoid a hold-out: the model is descriptive, so out-of-sample error would measure the model's absent forecasting ability rather than the data's recency. Pure in-sample R2 instead asks the honest question - how much recent data does the model struggle to fit?
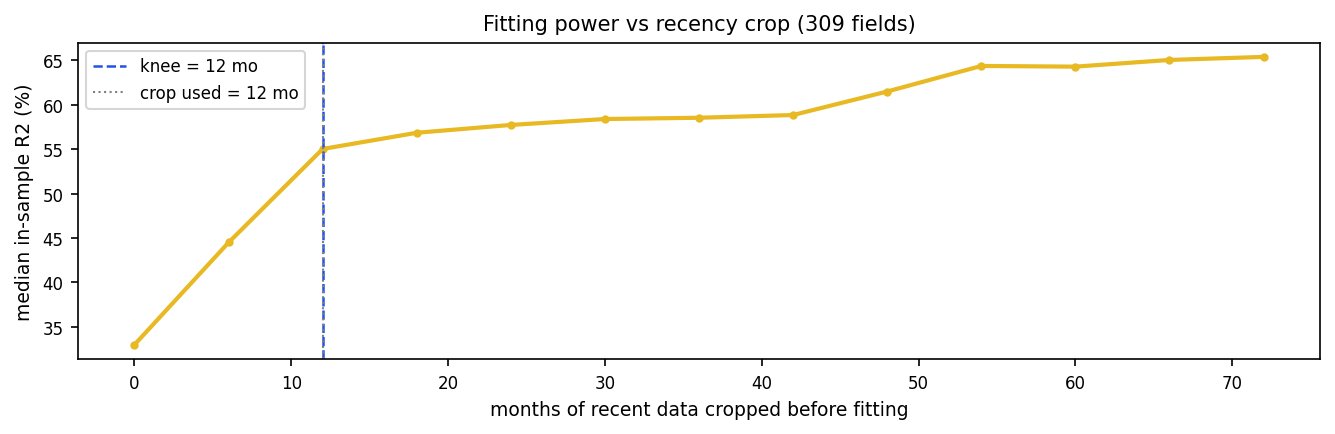
Median R2 climbs STEEPLY as the noisy recent months are dropped, from 33.0% at zero crop to about 55.0% by 12 months - the knee, the point of maximum curvature where the steep rise turns into a gentle climb. Past the knee the curve only creeps up, adding a few points over several more years to 65.4% by 72 months, the far edge of our 6-year sweep; we observe no decline within the window (Figure 1). The shape is an elbow, not a sharp optimum: almost all the fitting-power gain is captured within the first year-and-a-half, and the most recent months carry by far the most unfittable noise.
The seasonality model drops one year - a conservative choice just short of the ~12-month knee, shedding most of the unfittable recent noise while keeping the most data. The criterion needs no labels, no forecasting claim, and one tunable (the crop). It generalises to any descriptive time-series fit on revisable data.
All data underlying this study are openly available at https://artaquest.org/wp-content/uploads/research/ - the full-resolution monthly series, the sidereal ephemeris, and the result tables (atlas and recency curves). These files are the exact inputs to the analysis.
The complete analysis code is open in the ArtaQuest repository (the analysis/ directory). A one-click Google Colab notebook reproduces every figure and number from the hosted data: https://colab.research.google.com/gist/artaquest/6d2a073d195d3c075ac6d93d3c6f899d/recency.ipynb.
A.A. designed the study, performed the analysis, and wrote the manuscript.
The author declares no competing financial or non-financial interests.
This work received no external funding and was conducted under the ArtaQuest Foundation.
@article{ashrafnejad2026googletrendsrecencybias,
  title   = {Recency Bias in Google Trends: A Fitting-Power Criterion for Cropping the Recent Tail},
  author  = {Ashrafnejad, Arash},
  journal = {Journal of Seasonality},
  volume  = {1},
  number  = {2},
  year    = {2026},
  publisher = {ArtaQuest Foundation},
  url     = {https://artaquest.org/papers/google-trends-recency-bias.html}
}
Download citation: BibTeX · RIS · CSL-JSON | Full text: PDF · JATS XML | Licence: CC BY 4.0
Journal of Seasonality · open access (CC BY 4.0) · every article reviewed by AI and reproduced from its open data and code.